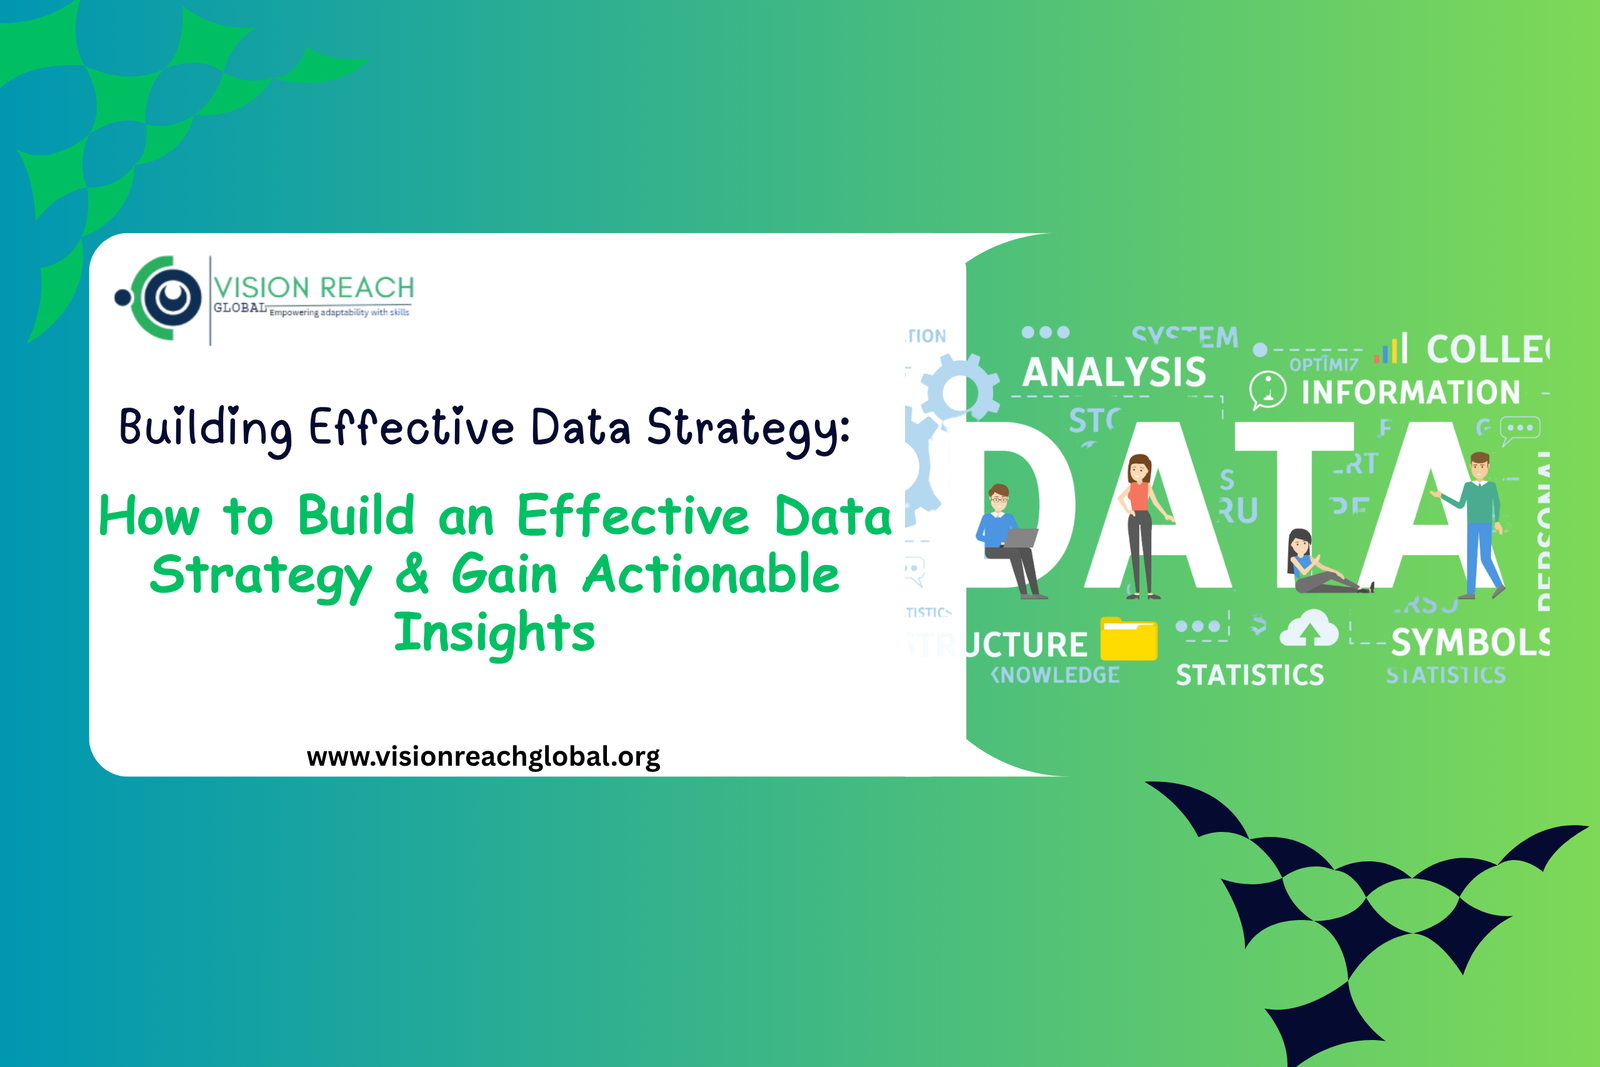
Every successful decision begins with reliable information. However, collecting data alone does not create value. Instead, businesses must develop a clear Data Strategy that turns raw information into meaningful insights. As competition grows, organizations that invest in data-driven decision-making, business intelligence, and data analytics gain a stronger advantage. Therefore, building an effective strategy is no longer optional but essential for sustainable growth.
Start with Clear Goals and a Strong Data Foundation
A successful Organizational Data Strategy and Planning process begins by defining clear business objectives. Once goals are established, every data initiative should support measurable outcomes while improving operational performance.
Key actions include:
- Define measurable business objectives that align every data initiative with organizational priorities, ensuring consistent success in strategic decision-making.
- Identify critical data sources across departments to eliminate silos and improve collaboration between operational and management teams.
- Develop data governance policies that protect sensitive information while maintaining quality, consistency, compliance, and accountability standards.
- Assign clear responsibilities for managing data assets, ensuring ownership, transparency, and continuous improvement throughout organizational processes.
- Establish performance indicators that measure strategy effectiveness, allowing timely adjustments based on accurate business intelligence insights.
A structured foundation ensures every department works with reliable information while reducing duplication, errors, and unnecessary operational costs.
Improve Data Capture, Collection, and Analysis
Quality insights depend on quality information. Therefore, organizations should strengthen their Data Capture, Collection, and Analysis processes before investing in advanced reporting tools. Accurate data collection improves forecasting, customer understanding, and operational efficiency.
Focus on these best practices:
- Automate data collection processes using digital platforms that minimize manual errors while increasing operational efficiency and reporting accuracy.
- Validate incoming information regularly to maintain high-quality datasets that consistently support dependable analysis and informed business decisions.
- Integrate multiple data sources into centralized systems for easier access, improved collaboration, and comprehensive organizational reporting capabilities.
- Monitor data quality continuously through regular audits that quickly identify inconsistencies before they affect strategic planning outcomes.
- Document collection procedures to ensure standardized practices across teams while improving compliance and long-term data reliability.
When organizations prioritize data quality, they create trustworthy information that supports confident decision-making.
Transform Information through Data Analytics
After collecting reliable information, the next step involves meaningful analysis. Modern data analytics helps organizations uncover trends, identify opportunities, predict future outcomes, and solve business challenges quickly.
Effective analytics allows teams to:
- Detect customer behavior patterns.
- Measure operational performance accurately.
- Forecast future business trends.
- Reduce organizational risks.
- Support evidence-based decisions.
Consequently, leaders spend less time guessing and more time implementing strategies backed by reliable insights.
Build Better Dashboards with Tableau Fundamentals
Visual storytelling makes complex information easier to understand. Learning Tableau Fundamentals enables professionals to create interactive dashboards that simplify large datasets into meaningful visual reports.
Tableau supports organizations by helping teams:
- Create interactive dashboards that transform complex datasets into clear visuals, supporting faster executive decision-making across departments.
- Build dynamic visual reports using charts, maps, and filters that improve stakeholder understanding and business communication.
- Monitor key performance indicators through real-time dashboards, providing immediate visibility into organizational progress and operational performance.
- Simplify complex datasets into understandable visual stories that improve collaboration between technical experts and business leaders alike.
- Share insights efficiently across departments, encouraging collaborative planning while supporting organization-wide data-driven decision-making practices.
Interactive dashboards make information easier to explore while improving communication among stakeholders.
Master Analyzing and Visualizing Data with Power BI
Organizations increasingly rely on Analyzing and Visualizing Data with Power BI to generate real-time business intelligence. Power BI transforms large volumes of data into clear visual reports that improve planning and performance monitoring.
Key advantages include:
- Connect multiple business systems into one reporting environment, providing unified visibility across finance, operations, sales, and marketing functions.
- Develop automated dashboards that refresh continuously, ensuring managers always have access to current business performance and operational intelligence.
- Generate customized reports tailored for executives, analysts, and operational teams supporting faster, evidence-based organizational decisions daily.
- Analyze business performance trends using powerful visualization features that reveal hidden opportunities and emerging organizational risks.
- Improve reporting efficiency by replacing manual spreadsheets with automated business intelligence solutions that enhance productivity and reporting accuracy.
Power BI enables organizations to monitor performance continuously while responding faster to changing business environments.
Unlock Deeper Insights with Qualitative Data Management and Analysis Using ATLAS.TI
Numbers explain what happened, yet qualitative data often explain why it happened. Qualitative Data Management and Analysis Using ATLAS.TI helps researchers organize interviews, surveys, focus groups, and textual information.
This approach supports organizations by:
- Organize qualitative research data from interviews, focus groups, and surveys for structured, efficient thematic analysis and interpretation.
- Code textual information systematically to identify recurring themes, emerging patterns, and valuable stakeholder perspectives with greater accuracy.
- Strengthen research quality through consistent analytical methods that improve credibility, transparency, and evidence-based decision-making across projects effectively.
- Visualize relationships between themes using analytical tools that simplify interpretation and strengthen qualitative research findings for stakeholders.
- Produce actionable insights supporting policy development, organizational learning, customer understanding, and strategic planning through comprehensive qualitative evidence.
Combining qualitative and quantitative analysis provides a more complete understanding of business challenges and opportunities.
Conclusion
Building an effective Data Strategy requires more than collecting information. Organizations must strengthen Data Capture, Collection, and Analysis, establish Organizational Data Strategy and Planning, and invest in modern analytics platforms. Furthermore, mastering Tableau Fundamentals, Analyzing and Visualizing Data with Power BI, and Qualitative Data Management and Analysis Using ATLAS.TI empowers professionals to convert raw data into actionable insights. Ultimately, organizations that embrace business intelligence, data governance, data visualization, predictive analytics, and data-driven decision-making position themselves for sustainable growth, stronger performance, and long-term success.